
WES Analytics - WES

WES Analytics
Connect analysis, statistical and reporting tools into the infrasture to enable the production of reports dashboards and summaries as standardized or custom implementations
Turn Data into Actionable Insights
WES Analytics provides the ability for organizations to connect analysis, statistical and reporting tools into the infrastructure to enable the production of reports, dashboards and summaries as standardized or custom implementations. A number of preconfigured reporting and analytics tool widgets that summarize and presents data and analytics clearly are provided.
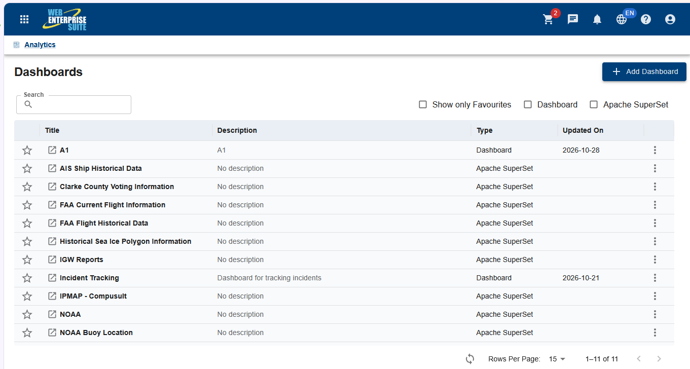
Once this option is selected a list of the preconfigured available dashboards are provided. By default, WES Analytics is configured with two analytical components:
WES Dashboard – A built in analytics/dashboard application that is ready out-of-the box.
Apache Superset - An open-source modern data exploration and visualization platform.
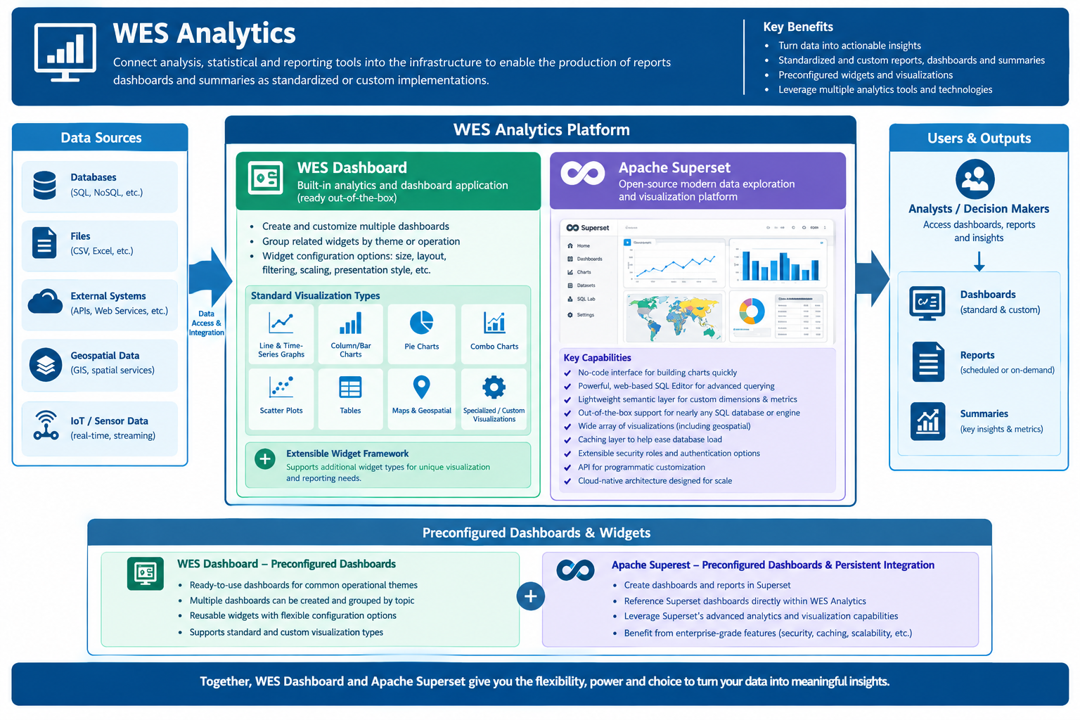
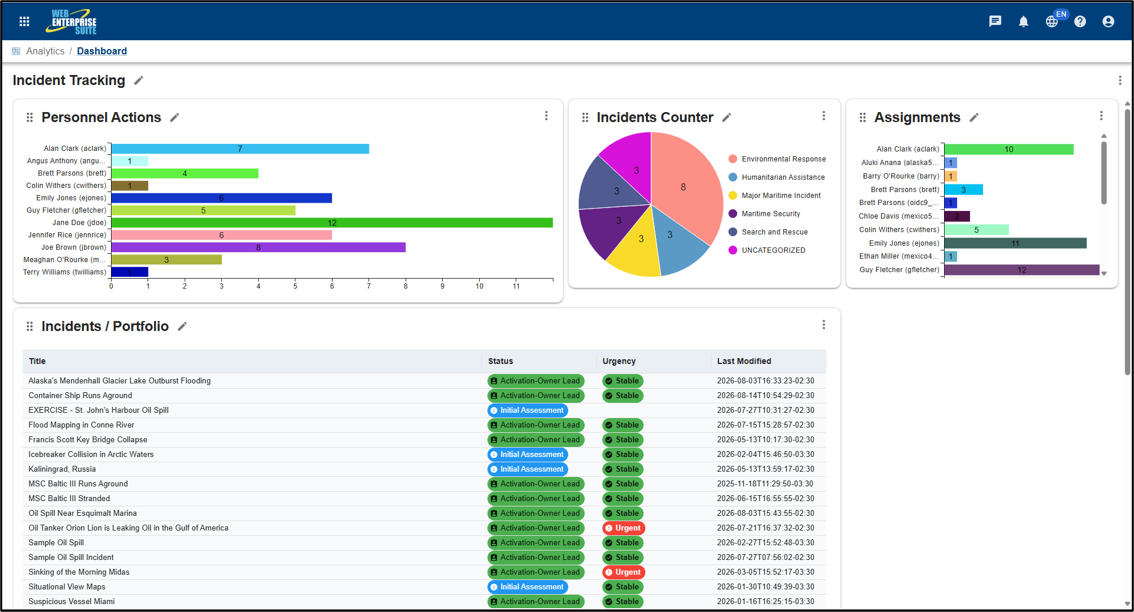
WES Dashboard supports the creation and customization of dashboards for ongoing analytics and reporting. Users can create multiple dashboards and group related widgets around specific monitoring or operational themes. Widget configuration options can include size, layout, filtering, scaling, presentation style, and other parameters.
The WES Dashboard widget framework supports a variety of standard visualization types, including:
- Line and time-series graphs
- Column/bar charts
- Pie charts
- Combination (combo) charts
- Two-dimensional scatter plots
- Tables and tabular views
- Maps and geospatial visualizations
- Specialized and custom visualizations
The underlying WES data model and widget architecture also support the development of additional widget types where a specific visualization or reporting requirement is not addressed by the standard library.
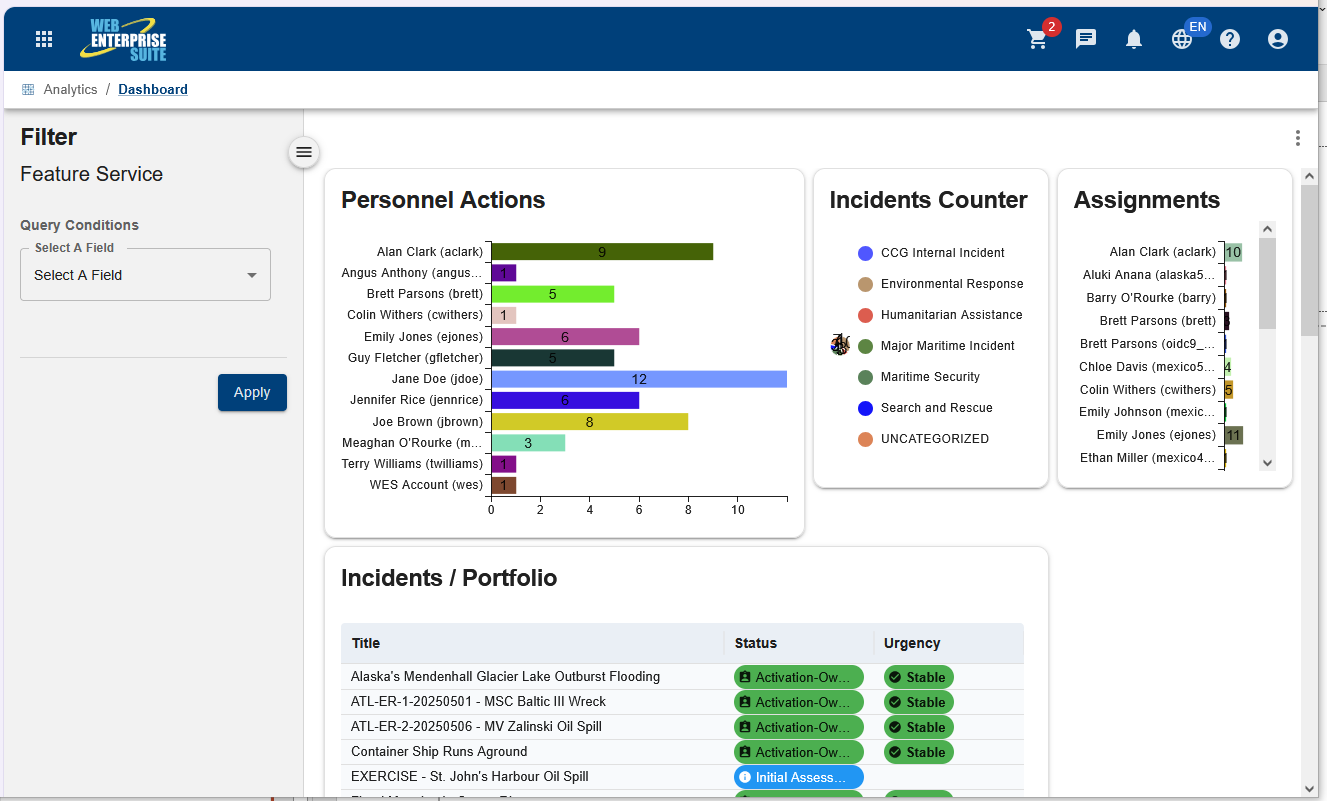
The following is an expansion on the Incident Tracking dashboard.
Capabilities
WES Analytics combined with Apache Superset provides
No-code chart builder
SQL Editor
Semantic layer
Broad data support
Rich visualizations
Caching
Security and authentication
API and cloud-native design
Examples
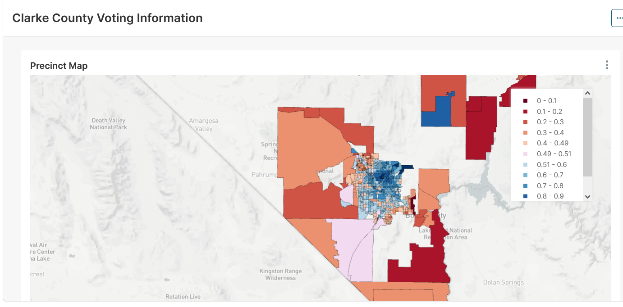
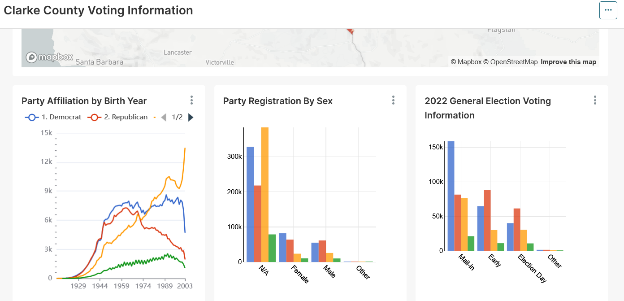
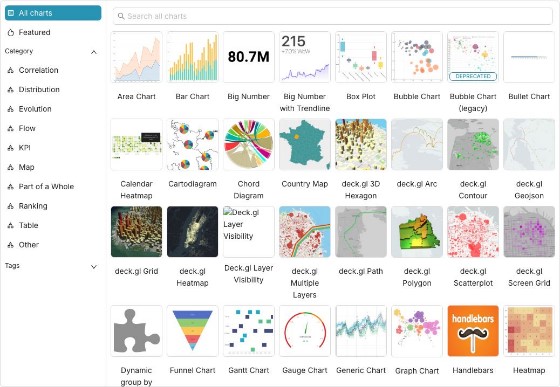
There is a large collection of pre-defined reports within Superset itself to support analytics and report generation.
WES Components
The tools and applications have been organized into the following components that are provided to organizations utilizing the capabilities:
WES Operations Center
WES Geospatial
WES Analytics
WES AI
WES Administration
Request a Live Demo
Access our demo site to use a sandbox version of WES.


